
MOT Failure Rate 2025–26: The Latest DVSA Statistics Explained
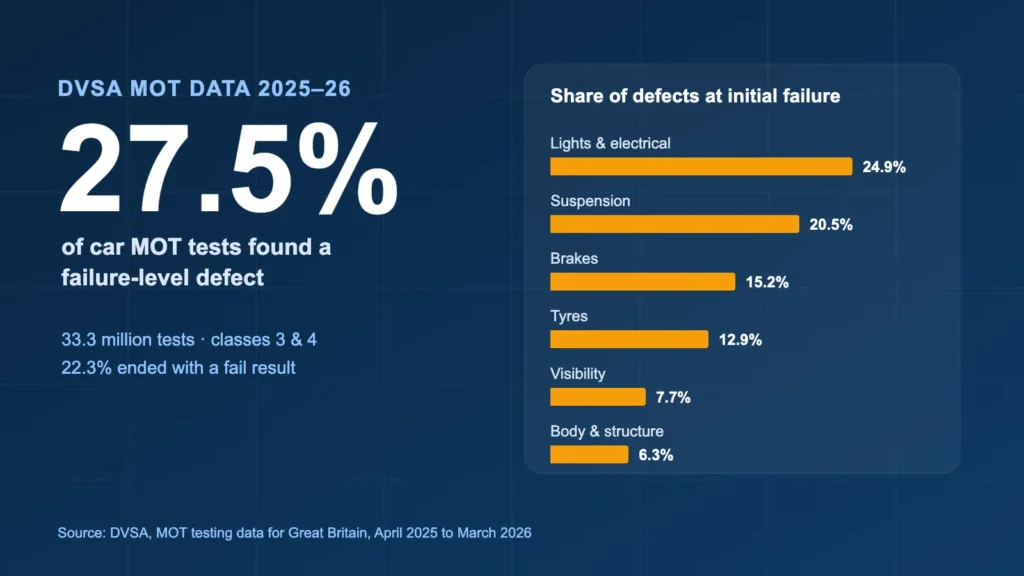
Latest DVSA figures: 27.5% of car MOT tests found a failure-level defect in 2025–26. The top failure reasons, the five-year trend and what drivers can check.
The Driver and Vehicle Standards Agency (DVSA) publishes official figures on the MOT tests carried out in Great Britain. The latest figures cover the year from April 2025 to March 2026, and they show how many cars fail, what they fail on and which faults are most likely to be dangerous. This page sets out the key numbers in plain English, explains what they mean, and lists the checks that would have prevented many of the failures. Every figure comes from DVSA's official data, and the sources are listed at the end.
Key MOT statistics at a glance (2025–26)
- 33.3 million MOT tests were carried out on cars, vans and passenger vehicles with up to 12 seats (classes 3 and 4).
- 27.51% found at least one failure-level defect at the start of the test. That is more than one in four.
- 22.30% ended with a fail result (7.43 million tests). The difference is cars that were repaired during the test and then passed.
- Lights are the biggest problem: lamps, reflectors and electrical equipment made up 24.89% of all defects recorded at an initial failure.
- Tyres cause most dangerous defects: 60.6% of dangerous defects were tyre faults, and brakes were another 28.8%.
- A failed MOT involves more than one fault: on average, an initial failure had 2.39 defects.
- The fail rate is slowly falling: the initial fail rate has dropped from 29.21% in 2021–22 to 27.51% in 2025–26. In the latest quarter (April to June 2026) it was 26.75%.
Initial fail rate vs final fail rate: what's the difference?
DVSA publishes two fail rates, and they measure different things.
- Initial fail rate (27.51%): the share of tests where the car arrived with at least one failure-level defect. It includes about 1.73 million tests where the fault was fixed at the test centre during the test and the car then passed. DVSA calls this "pass after rectification".
- Final fail rate (22.30%): the share of tests that ended with a fail result. It doesn't mean the car failed again after a retest. It simply means the test finished as a fail.
So when you see a headline that says "more than one in four cars fail their MOT", it usually refers to the initial fail rate. Both figures are correct; they answer different questions.
The MOT fail rate over the last five years
These figures are for classes 3 and 4 (cars, vans and passenger vehicles with up to 12 seats), by financial year (April to March).
| Year | MOT tests | Initial fail rate | Final fail rate |
|---|---|---|---|
| 2021–22 | 31,617,600 | 29.21% | 23.09% |
| 2022–23 | 32,543,026 | 28.38% | 22.40% |
| 2023–24 | 32,693,703 | 28.58% | 22.95% |
| 2024–25 | 33,128,617 | 28.08% | 22.67% |
| 2025–26 | 33,310,534 | 27.51% | 22.30% |
The number of tests has gone up each year, while the initial fail rate has drifted down by about 1.7 percentage points over five years. It is still the case that more than one car in four turns up to its MOT with a fault serious enough to fail.
The most common reasons cars fail their MOT
The table below shows the main defect categories recorded at an initial failure in 2025–26. "% of defects" is each category's share of all failure-level defects. "% of tests" is the share of all MOT tests where at least one defect in that category was found.
| Defect category | % of defects | % of tests |
|---|---|---|
| Lamps, reflectors and electrical equipment | 24.89% | 10.44% |
| Suspension | 20.49% | 8.90% |
| Brakes | 15.18% | 6.10% |
| Tyres | 12.94% | 6.23% |
| Visibility (windscreen, wipers, washers, mirrors) | 7.72% | 4.28% |
| Body, chassis and structure | 6.26% | 3.23% |
| Noise, emissions and leaks | 5.89% | 3.08% |
| Steering | 3.59% | 1.94% |
| Seat belts and restraint systems | 1.64% | 0.95% |
| Road wheels | 0.76% | 0.38% |
| Identification of the vehicle | 0.63% | 0.33% |
Lights stand out. A lighting or electrical defect was found on just over one test in ten, and together lights, tyres and visibility made up around 46% of all defects recorded. Some of these, like a blown bulb or a split wiper blade, are easy to spot at home. Others, such as headlamp aim, suspension wear or corroded brake pipes, need a technician. Our guide to the most common MOT failure reasons explains each category in more detail.
Enter your registration and postcode for a fixed price. Your MOT is done at an approved test centre and is discounted when you book it with a service.
Dangerous defects: tyres and brakes dominate
Since May 2018, MOT defects are graded as dangerous, major or minor. A dangerous defect means the car shouldn't be driven until it's repaired. The 2025–26 figures show where those dangerous defects come from:
- Tyres: 60.6% of all dangerous defects. A dangerous tyre defect was recorded on 4.47% of all tests, roughly one in 22.
- Brakes: 28.8% of dangerous defects.
- Suspension: 5.3% of dangerous defects.
Between them, tyres and brakes account for almost nine in ten dangerous defects. Both wear gradually, so a regular look at your tyres and an annual brake check catch most problems long before the MOT. Our guides to MOT tyre rules and dangerous, major and minor MOT defects explain what testers look for.
How many MOT test centres and testers are there?
In 2025–26 there were 23,092 private MOT test stations and 222 other test stations in Great Britain, with 66,925 nominated MOT testers. Only approved test centres can carry out an MOT, and they display the blue sign with three white triangles.
What these numbers mean for drivers
The statistics point to a handful of checks that would prevent a large share of failures. Before your MOT:
- Lights: check every bulb, including brake lights, indicators, the rear fog light and the number plate lights.
- Tyres: at least 1.6mm of tread across the central three-quarters of the tread, around the whole circumference, with no cuts or bulges.
- Wipers and washers: the blades should clear the screen and the washer bottle should be full.
- Windscreen: look for chips or cracks, especially in the driver's line of sight.
- Warning lights: note any warning lights on the dashboard and have them checked before the test.
- Brakes and suspension: if the car pulls to one side, makes knocking noises over bumps or the brakes feel different, have it looked at before the test rather than during it.
Our pre-MOT checklist takes you through each check step by step. If your car does fail, the MOT retest rules explain when a retest is free.
Sources and method
- Source: DVSA, MOT testing data for Great Britain (GOV.UK, updated 10 September 2026).
- Tables used: DVSA/MOT/01 (test results by class of vehicle), DVSA/MOT/03 (class 3 and 4 initial failures by defect category) and DVSA/MOT/06 (MOT test stations and testers).
- Vehicles: classes 3 and 4, which covers cars, vans and passenger vehicles with up to 12 seats. Motorcycles, larger passenger vehicles and goods vehicles are not included.
- Period: financial years (April to March). The latest full year is April 2025 to March 2026; the latest quarter is April to June 2026.
- Notes: the initial fail rate includes defects put right during the test. Defect percentages are shares of all failure-level defects recorded, not shares of vehicles. Retests, abandoned and aborted tests are excluded from DVSA's test counts.
You're welcome to use these figures. Please credit DVSA as the source and link to this page.
How Hon Car Service can help
Hon Car Service is an online booking platform for car servicing, MOTs and repairs across the UK. Enter your car registration and postcode for an instant fixed price with parts and labour included. Your MOT is carried out at an approved test centre and is discounted when you book it with a service. Choose free collection and return, a mobile mechanic at home or work for repairs, or a trusted local garage. Your card is pre-authorised when you book and only charged after the work is done and approved, and every job comes with a 12-month parts and labour warranty.
Book your MOT online at an approved test centre, with free collection and return and a fixed price before you book.
FAQs
What is the MOT failure rate in the UK?
In Great Britain in 2025–26, 27.51% of car and light van MOT tests found at least one failure-level defect at the start of the test, and 22.30% ended with a fail result. Northern Ireland runs its own vehicle testing and isn't included in these figures.
What is the most common reason for an MOT failure?
Lamps, reflectors and electrical equipment. They made up 24.89% of all defects recorded at an initial failure in 2025–26, followed by suspension (20.49%), brakes (15.18%) and tyres (12.94%).
What's the difference between the initial and final MOT fail rate?
The initial fail rate counts every test where the car arrived with a failure-level defect, including faults fixed during the test. The final fail rate counts only tests that ended with a fail result.
Is the MOT fail rate going down?
Slowly. The initial fail rate for cars and light vans fell from 29.21% in 2021–22 to 27.51% in 2025–26, and was 26.75% in April to June 2026.
Which MOT defects are most often dangerous?
Tyres. In 2025–26 tyres made up 60.6% of all dangerous defects and brakes another 28.8%.
How many MOT test centres are there?
In 2025–26 there were 23,092 private MOT test stations and 222 other test stations in Great Britain, with 66,925 nominated testers.